
Investors
OverviewThe AFL-CIO Housing Investment Trust (“HIT”) seeks to generate competitive, risk-adjusted total rates of return for its participants relative to the Bloomberg U.S. Aggregate Bond Index. The HIT seeks to accomplish this objective through a focus on multifamily mortgage-backed securities while simultaneously encouraging the construction and preservation of rental housing and facilitating employment for union members in the construction trades.
HIT DIFFERENCE
- Competitive Returns relative to its benchmark, the Bloomberg U.S. Aggregate Bond Index.
- Focus on Multifamily MBS, providing investors with important diversification within the fixed-income sector.
- Creation of Union Construction Jobs and Affordable Housing addressing issues important to working people.
HOW TO INVEST
The HIT is an open-ended mutual fund available to eligible institutional investors.
- The HIT is valued monthly as of the last business day of the month.
- Units are sold directly by the HIT without any sales charge (load) or commissions.
- Purchase price is equal to the units’ net asset value as of the close of business of the major bond markets in New York on the last business day of each month.
- Funds received prior to the last day of the month are invested in a short-term investment vehicle until the last day of the month, at which time funds are invested in the HIT.
- Funds must be received by 4:00PM Eastern Time on the last business day of the month to be invested for that month.
See the Prospectus for additional information. Defined contribution plan investors can also access the benefits of the HIT through the AFL-CIO Housing Investment Trust Daily Valued Fund (HIT-DVF), a collective investment fund offered by Hand Benefits & Trust.

Performance
The performance data provided represents past performance. Past performance is no guarantee of future results. Economic and market conditions change, and both will cause investment return, principal value and yield to fluctuate so that a Participant's units when redeemed may be worth more or less than their original cost. Current performance may be lower or higher than the performance data quoted. Gross performance figures do not reflect the deduction of HIT expenses. Net performance figures reflect the deduction of HIT expenses and are the performance figures investors experience in the HIT. Information about HIT expenses can be found on page 1 of the HIT’s current prospectus. The HIT is internally managed and participants pay only for the actual expenses of operating the HIT. The Bloomberg U.S. Aggregate Bond Index (“Bloomberg Aggregate”) reflects no deductions for expenses and is not available for direct investment. Investors should consider the HIT's investment objectives, risks and expenses carefully before investing. A Prospectus containing more complete information may be obtained from the HIT by calling the Marketing Department at 202-331-8055, or by viewing the above-referenced link. The prospectus should be reviewed carefully before investing.
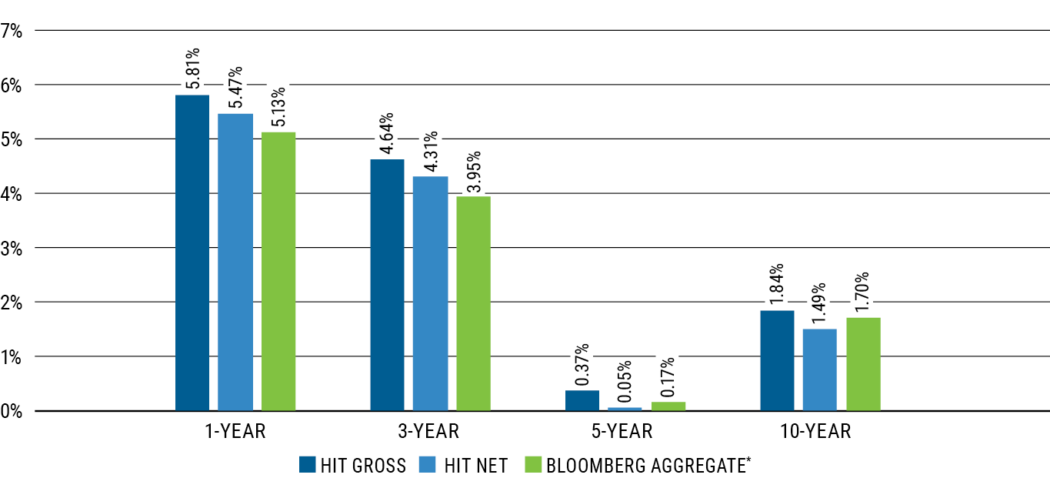
The graph below shows the comparative rolling annual returns of the HIT and Bloomberg Aggregate, demonstrating the strong correlation.


This chart shows the competitive value growth of $50,000 invested in the Trust (minimum initial investment) and its benchmark (theoretical values) over the course of ten years, assuming the reinvestment of all distributions.

The net asset value of the Trust as of May 31, 2026 was $7,442,187,096.
The graph above depicts the growth of Trust assets. Asset growth of the Trust has several components, including portfolio performance (primarily interest income on investments less the expenses of the Trust), capital gains and losses, and inflows of new capital less redemptions.
The Trust’s income less operating expenses is distributed monthly to Participants. Year to date, participants choose to automatically reinvest approximately 92% of distributions.
Portfolio

^Chart based on value of total investments and includes unfunded commitments but does not include U.S. treasury futures contracts.
The following are general descriptions of certain types of investments that may be held by the HIT and are not intended to describe all assets actually held in the HIT’s current portfolio.
- Multifamily Construction Mortgage-Backed Securities: The Trust invests in fixed-income securities that finance the construction of multifamily properties. These securities generally have credit enhancements from FHA, Ginnie Mae (GNMA), or a letter of credit or repurchase guarantee from an entity rated “A” or better. These securities generally fund over 12-24 months and upon completion of construction, a permanent security is issued. These securities typically generate yields above U.S. Treasury investments with comparable average lives and generally have significant prepayment protections.
- Multifamily Permanent Mortgage-Backed Securities: The Trust invests in securities that are either backed by permanent loans for multifamily properties or by loans for existing single family homes. These FHA, GNMA, Fannie Mae, or Freddie Mac credit enhanced investments typically generate yield spreads above U.S. Treasury investments with comparable average lives. Additionally, multifamily mortgage-backed securities generally have significant prepayment protections.
- State Housing Finance Agency Securities: The Trust may invest in securities that are backed by construction and/or permanent loans for multifamily properties having evidence of support by a state or local government and that, among other things, are guaranteed or insured by a state or local housing finance agency (“A” rated or better or top tier by Standard and Poor’s); are secured by recourse to such assets of the Housing Finance Agency as to provide protection comparable to a pledge of the agency’s general credit; or satisfy other indicia of credit quality set out in the Declaration of Trust.
- Single Family Mortgage-Backed Securities: The Trust invests in securities that pool individual mortgages from single family homes. The interest and principal cash flows are passed through to the investor of the MBS net of any servicing fees. These Fannie Mae, GNMA, or Freddie Mac credit enhanced investments typically generate yield spreads above U.S. Treasury bonds. There is no prepayment protection on these securities meaning payments could be more than the scheduled amount.
- Construction and Permanent Loans: The Trust invests in direct, bridge and other loans used to finance the purchase, refinance development and/or construction of a property.

^Chart based on value of total investments and includes unfunded commitments but does not include U.S. treasury futures contracts.

The calculations of the HIT yield herein represent widely accepted portfolio characteristics information based on coupon rate, current price and, for yield to worst, certain prepayment assumptions, and are not current yield or other performance data as defined by the SEC in Rule 482.
The HIT’s long-standing investment strategy is to construct a portfolio with similar interest rate risk relative to the Bloomberg Aggregate by actively managing duration, while maintaining superior credit quality and a higher yield relative to the benchmark.
- The HIT does not invest in corporate bonds or low credit quality securities.
- HIT uses government/agency-insured multifamily MBS as a substitute for corporate debt and some Treasury and agency securities in the benchmark.
- These multifamily MBS have superior credit quality relative to corporate debt, but typically have similar call protection.
- The HIT’s yield measures have been, in the past, generally higher than the benchmark’s.
- Although historical month-over-month returns comparing the HIT to the Bloomberg Aggregate show significant correlation, with approximately 99% correlation for the five-year period ending May 31, 2026, the HIT’s very different composition may offer diversification benefits from other fixed-income investments and generally higher risk oriented asset classes, such as equities.
The table above compares the HIT’s portfolio risk measures to those of the Barclays Aggregate.